
Home › Mutual Fund X-Ray
Free tool · no sign-up
Mutual Fund X-Ray: see what is really inside your funds
One statement lists every mutual fund you own, with every fund house, whoever you bought it through. Upload it and in a minute you have the whole picture: what it is worth today and what it has earned, which companies your funds hold between them, where they overlap, where each fund stands in its category, how the same funds fared in the market's past falls, what they cost, and what selling any of it would mean for tax.
Opens on invest.tenxinvestment.com, TenX's own secure server, where the statement is read.
What the X-Ray shows
Everything you own, at today's value
Every fund from every fund house on one page, valued at its latest NAV with your statement's NAV beside it: what it is worth today, what you paid, the gain, and the yearly return on every rupee you put in and took out.
The companies behind your funds
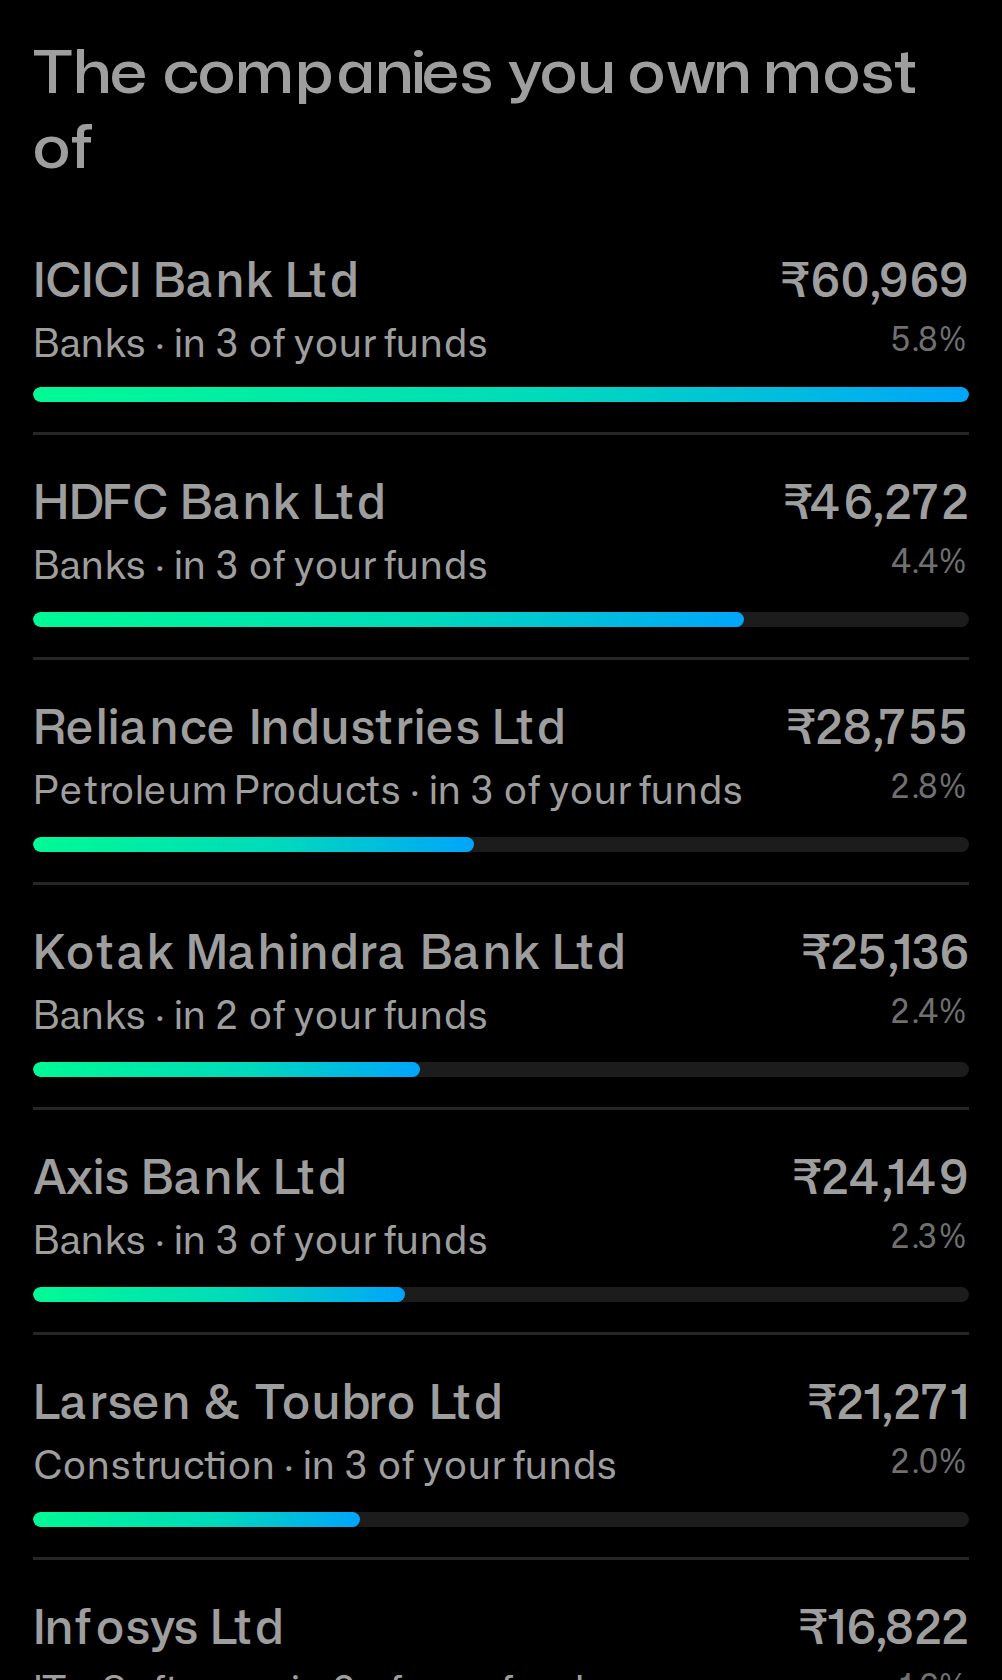
Your funds own shares. The X-Ray adds them up across all your funds, so you see how much of your money is really in each company and industry.
Where your funds overlap
Two funds that hold the same shares move together. The X-Ray shows which of your funds have a fifth or more of their portfolios in common.
Each fund beside its category
Returns over 1, 3 and 5 years beside the middle fund of its category, its yearly cost, riskometer and exit load, and where it stands among every fund of that category.
Tax, worked out lot by lot
Gains by financial year with a Schedule 112A file, how much you can withdraw today free of exit load and tax, and when locked ELSS units come free.
Who each fund was bought through
A statement names the distributor behind every fund. See what is with which distributor and what is in direct plans.
Your funds in the market's past falls
The funds you hold today, in today's proportions, followed on their own NAVs through 2008, 2015–16, 2020 and the latest fall: how low your money would have gone, in rupees, and how long it took to come back.
How much of each fund is its index
For every fund run by a manager, the part of it that is simply its index, and what it costs a year beside an index fund on the same index.
Family folios, nominees and shares
If your statement lists a family member's folios, the X-Ray says whose are whose and works out tax person by person. It names folios with no nominee or unfinished KYC, and counts in the shares you hold directly.

Where each of your funds stands in its category
Choose any fund in your X-Ray to set it beside every other fund of its category, regular plans with regular plans and direct with direct. You see its returns over 1, 3 and 5 years, its size and how long it has run, with its place by each (8th of 36 by 3-year return, say) and a picture of it: every fund of the category is a dot along a line, and yours is the bright one, so you see at once how many returned less and how many more. Point at any dot to follow that fund down every line. The whole category is also in one list that sorts by any of these.

How it works
- Ask CAMS for your statement. On camsonline.com choose Statements, then “CAS – CAMS+KFintech”. It covers every fund house in one go.
- Choose “Detailed”, a period from your first investment (01-Jan-1990 is safe) to today, and “with zero balance folios”. A detailed statement lists every purchase and sale, which is what gains and tax are worked out from.
- Give your email and choose a password. The PDF reaches your inbox in a few minutes.
- Upload that PDF with its password, exactly as it arrived. Your X-Ray opens in about a minute.
Your statement, your data
What happens to it
- It is read on TenX's own server and is not sent to anyone else.
- The PDF and its password are not kept. Nor are PANs, your email, address and mobile number, or nominees' names: only which folios share a PAN, and whether each has a nominee.
- The name on each folio, the funds, folio numbers and transactions are kept encrypted for 90 days, so you can open the X-Ray again, and then deleted.
- One button on the report deletes everything at once.
Who sees it
- You, through a private link to your X-Ray.
- TenX Investment, an AMFI-registered mutual fund distributor (ARN-185393). The upload form says so and asks you to agree first.
- TenX calls or messages you only if you ask. You can, from the report, with one tap.
- More in our privacy policy.
Questions people ask
What is the Mutual Fund X-Ray?
A free reading of your mutual fund statement. You upload the consolidated account statement that CAMS and KFintech email you, and it shows what you hold, what it has earned, the companies your funds own between them, where the funds overlap, what they cost and what selling would mean for tax.
Which statement do I upload?
The Consolidated Account Statement (CAS) from CAMS and KFintech: ask for the “Detailed” kind, from your first investment to today, on camsonline.com. It comes to your email as a password-protected PDF within minutes. The monthly statement from NSDL or CDSL also works for funds held in a demat account, and the X-Ray then sets the shares in that account beside the same companies inside your funds. Upload the PDF exactly as it arrived: a copy that was printed or saved again, or MF Central's own statement, cannot be read.
My X-Ray shows no gain or tax. Why?
Because the statement you uploaded does not go back to when you bought the funds. A statement for this year alone, say, begins with units you already held: it does not show what you paid or when, and gain, absolute return, the yearly return and tax all need that. Ask CAMS for a “Detailed” statement whose period starts before your first investment (01-Jan-1990 is safe) and upload that: every figure is then exact. If you cannot, the X-Ray lets you type in the amount and the date for each fund, which is enough for the gain and for an estimate of tax.
My statement is a few weeks old. Will the X-Ray be out of date?
No. The X-Ray takes the units from your statement and values them at each fund's latest NAV from AMFI, so what it is worth, the gain, the yearly return and the tax figures are as of today, and it is valued afresh every time you open it. The NAV and value printed in your statement are shown beside today's, so you can see what the market has done since. Anything you bought or sold after the statement was made is not in it: for that, ask for a fresh statement.
Is it free? Do I have to sign up?
It is free and there is nothing to sign up for. You may leave a mobile number if you would like Prateek to walk you through your X-Ray, and you do not have to.
Who can see my statement?
You, and TenX Investment, which runs the tool on its own server and is a mutual fund distributor (ARN-185393). The upload form says this before you upload and asks you to agree. The statement is not sent to anyone else, and TenX contacts you only if you ask to be called.
What is kept, and for how long?
The name on each folio, the funds, folio numbers and transactions, kept encrypted for 90 days so the X-Ray can be opened again, then deleted. The PDF, its password, PANs, your email, address and mobile number, and nominees' names are not kept: of a PAN only which folios share one is noted, and of a nominee only whether one is registered. A “Delete this X-Ray” button on the report removes everything at once.
What would a market crash have done to my funds?
The X-Ray takes the funds you hold today, in today's proportions, and follows them on their own daily NAVs through four past falls: 2008, 2015–16, 2020 and the deepest since mid-2024. For each it shows how low your money would have gone, in rupees, the day it was lowest, and how long it took to be worth again what it began with, beside the Nifty 500. A fund launched after a fall began is replaced by the index its category is measured against, or left out, and the X-Ray says which. It is what happened, not a forecast: the funds held different shares then.
Why does my X-Ray show a family member's funds too?
A statement asked for by email address lists every folio that carries that address, whoever's PAN it is under, so a spouse's or a parent's folios can be in it. The X-Ray says how many people's folios it holds, lists each person's, and lets you see one person's alone. Tax is worked out person by person, because each PAN has its own tax-free limit.
Does the X-Ray check nominees and KYC?
Yes. A detailed statement prints, for every folio, whether a nominee is registered and whether KYC is complete. The X-Ray has a Nominee & KYC tab that lists every folio with both, and names the folios where no nominee is registered or KYC is not shown as complete. It keeps only that yes or no: who your nominees are is not kept.
How much of my fund is just its index?
For each diversified equity fund the X-Ray sets its latest portfolio beside the index its category is measured against: for every share both hold, the smaller of the two weights, added up. That is the part of the fund that is the index; the rest is where the manager differs. It also shows what the fund costs a year beside an index fund on the same index. It describes two portfolios on one day and is not a judgement of the fund.
Does the X-Ray tell me what to buy or sell?
No. It describes what your statement shows. TenX Investment is a mutual fund distributor, not an investment adviser, and nothing in an X-Ray is a recommendation to buy, sell, hold or move an investment.
Does it work for direct plans and funds bought through other distributors?
Yes. The statement covers every fund you hold, whoever you bought it through, and the X-Ray shows all of them.
Can I see how a fund of mine stands against others like it?
Yes. Every fund in your X-Ray opens a page that lists all the funds of its category in the same kind of plan, regular or direct, with their returns over 1, 3 and 5 years, their size and how long they have run. It gives your fund's place by each of these, for example 8th of 36 by 3-year return. That describes the past: it is not a rating, and not a recommendation.
How is overlap worked out?
From each fund house's monthly portfolio disclosure. For every company that two funds both hold, the smaller of the two weights is taken, and these are added up. 60% overlap means three-fifths of the two portfolios is the same.
Are the tax figures final?
They are estimates from your statement, not a tax computation. They follow today's rules for equity and debt funds, and some hybrid, gold and overseas funds are taxed differently. Confirm with your tax adviser before you act on them.
TenX Investment is an AMFI-registered mutual fund distributor (ARN-185393), not an investment adviser. It earns commission from fund houses on the regular plans it distributes. An X-Ray describes what a statement shows and is not a recommendation to buy, sell, hold or move any investment. Fund returns and positions in a category describe the past; past performance may or may not be sustained in future. Tax figures are estimates, not a tax computation. Mutual fund investments are subject to market risks, read all scheme related documents carefully.